What Are The Graph Quadrants

Welcome to the wonderful world of graph quadrants! If you’ve ever looked at a graph and felt a little lost, think of quadrants as your trusty compass for navigating the coordi...
Welcome to the wonderful world of graph quadrants! If you’ve ever looked at a graph and felt a little lost, think of quadrants as your trusty compass for navigating the coordinate plane. They’re not just abstract math—they’re the secret sauce behind everything from video game maps to designing a city grid. Once you master them, you’ll unlock a fun way to organize data, solve puzzles, and even understand your favorite TikTok filters. Ready to have some “aha!” moments? Let’s dive in.
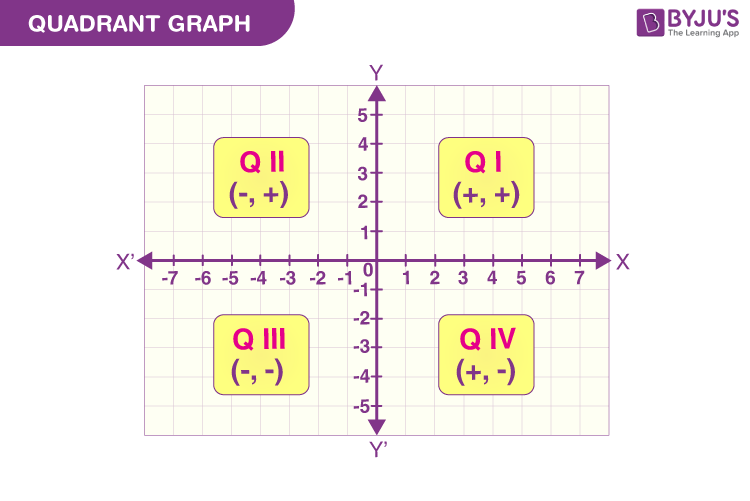
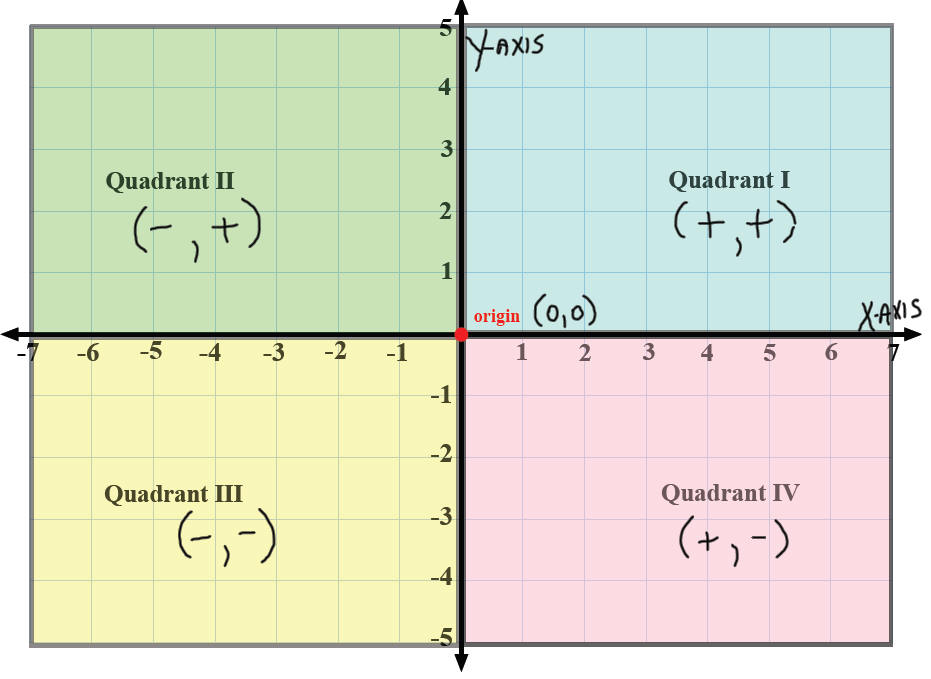
At its core, a graph quadrant is one of four sections created when a horizontal x-axis meets a vertical y-axis. These quadrants are numbered counterclockwise, starting from the top right. Why does that matter? Because each quadrant tells you exactly where a point lives—like giving an address to a dot! For example, the top-right Quadrant I has both positive x and y values (think: happy, sunny corner). Quadrant II (top-left) is negative x, positive y—like a mirror reflection. Quadrant III (bottom-left) is all-negative, and Quadrant IV (bottom-right) flips to positive x, negative y. This system makes data come alive, letting you spot trends at a glance.
Now for the creative spark: imagine you’re designing a superhero city. Quadrant I could be the wealthy downtown (positive, positive—everything’s great!). Quadrant II might be the artsy hills (negative x, positive y—quirky but elevated). Quadrant III, the underground lair (negative, negative—dark and mysterious), and Quadrant IV, the coastal tech hub (positive x, negative y—innovative but a bit chaotic). See how quadrants turn abstract numbers into a story? Another example: in baking, you could plot cookie taste (x-axis) versus crunchiness (y-axis). Points in Quadrant I would be heavenly—tasty and crispy. Points elsewhere? Time to tweak the recipe!
Must Read
Here’s a practical tip: always start with the x-coordinate (first number in a pair) when plotting. Move left or right from zero, then go up or down for y. This prevents mix-ups. A common “gotcha” is forgetting that Quadrant III has both negatives—people often jump there incorrectly. Try this fun trick: draw a tiny “+ +” in Quadrant I’s corner, “- +” in II, “- -” in III, and “+ -” in IV. Stick it on your wall as a cheat sheet until it clicks.
 Quadrants Math Algebra Graphing
If you want to practice, grab some graph paper (or a free app) and plot these points: (3,2), (-3,2), (-3,-2), (3,-2). Connect them—you’ll make a rectangle. Now move one point to a different quadrant—see how the shape stretches or flips? That’s geometry in action! For a real-world challenge, chart your weekly mood (x = hours of sleep, y = happiness). Are you mostly in Quadrant I? Congratulations! If not, your data might signal you need more rest or more fun.
Remember, quadrants aren’t just for math class—they’re a tool for seeing patterns in life. Whether you’re comparing ice cream sales versus temperature (spoiler: all in Quadrant I on a hot day) or mapping your budget’s “fun spending” vs. “savings,” quadrants give you clarity. So next time you see a graph, don’t flinch—you’re now part of the four-corner club. Go plot something awesome!